6. 如何消除Vuvuzela?
什么是Vuvuzela? 看过南非世界杯的同学们, 肯定会对比赛中响彻全场的Vuvuzela(俗称南非大喇叭)有非常深刻的印象. 本来作为一种庆祝乐器, 但是当这种声音充斥这整个比赛过程, 让听众无法听清到现场解说员的讲解, 大大降低了观赛的舒适度.

那么如何利用数字信号处理的方法将Vuvuzela的噪声从信号中滤除掉呢? 下面我们将介绍一种简单的算法, 来完成这个任务.
Vuvuzela cancellation with spectral subtraction technique. Based on the spectrum of the vuvuzela only sound, this denoising technique simply computes an antenuation map in the time-frequency domain. Then, the audio signal is obtained by computing the inverse STFT. See [1] or [2] for more detail about the algorithm.
References:
[1] Steven F. Boll, “Suppression of Acoustic Noise in Speech Using Spectral Subtraction”, IEEE Transactions on Signal Processing, 27(2),pp 113-120, 1979
[2] Y. Ephraim and D. Malah, ?Speech enhancement using a minimum mean square error short-time spectral amplitude estimator,? IEEE. Transactions in Acoust., Speech, Signal Process., vol. 32, no. 6, pp. 1109?1121, Dec. 1984.
Note: The file: Vuvuzela.wav must be located in the folder of this script file. One can note that this time-frequency based technique creates a “musical noise”.
[1]:
clear;close all;clc;

fprintf('--- Vuvuzela Cancelation Program ---\n\n');

%load vuvuzela sound example
fprintf('-> Step 1/5: Load vuvuzela.wav:');
[y,Fe]=audioread('Vuvuzela.wav');
x=y(100000:end,1).';  %remove the beginning of the sample
Nx=length(x);
fprintf(' OK\n');
--- Vuvuzela Cancelation Program ---

-> Step 1/5: Load vuvuzela.wav: OK
6.1. 利用短时傅里叶变换计算语音信号的频谱
短时傅里叶变换(STFT)通常被用来分析非平稳信号的频率成分随时间变化的性质.

对信号进行滑动窗分析, 首先定义长度为\(M\)的滑动分析窗\(g[n]\), 计算加窗之后的信号. 然后,对每个加窗之后的信号进行傅里叶变换:
其中\(R\)为窗口滑动的步长, 且\(R=M-L\). \(L\)为连续两个滑动窗口交叠区域的长度.
[2]:
%algorithm parameters
apriori_SNR=1;  %select 0 for aposteriori SNR estimation and 1 for apriori (see [2])
alpha=0.05;      %only used if apriori_SNR=1
beta1=0.5;
beta2=1;
lambda=3;

%STFT parameters
NFFT=1024;
window_length=round(0.031*Fe);
window=hamming(window_length);
window = window(:);
overlap=floor(0.45*window_length); %number of windows samples without overlapping

%Signal parameters
t_min=0.4;    %interval for learning the noise
t_max=1.00;   %spectrum (in second)

%construct spectrogram
[S,F,T] = spectrogram(x+i*eps,window,window_length-overlap,NFFT,Fe); %put a short imaginary part to obtain two-sided spectrogram
imshow(abs(S))
[4]:
%----------------------------%
%        noisy spectrum      %
%          extraction        %
%----------------------------%
[Nf,Nw]=size(S);
fprintf('-> Step 2/5: Extract noise spectrum -');
t_index=find(T>t_min & T<t_max);
absS_vuvuzela=abs(S(:,t_index)).^2;
vuvuzela_spectrum=mean(absS_vuvuzela,2); %average spectrum of the vuvuzela (assumed to be ergodic))
vuvuzela_specgram=repmat(vuvuzela_spectrum,1,Nw);
fprintf(' OK\n');
-> Step 2/5: Extract noise spectrum - OK
[4]:
# %---------------------------%
# % Estimate SNR %
# %---------------------------%
print('-> Step 3/5: Estimate SNR -');
absS=np.abs(S)**2
SNR_est = absS/vuvuzela_specgram - 1
SNR_est[SNR_est<0] = 0
# 这里需要进一步对估计的信噪比做滤波处理
apriori_SNR = 1 # select 0 for aposteriori SNR estimation and 1 for apriori (see [2])
alpha = 0.05 # only used if apriori_SNR=1
if apriori_SNR==1:
SNR_est=signal.lfilter([1-alpha],[1,-alpha],SNR_est) #a priori SNR: see [2]
print(' OK\n');
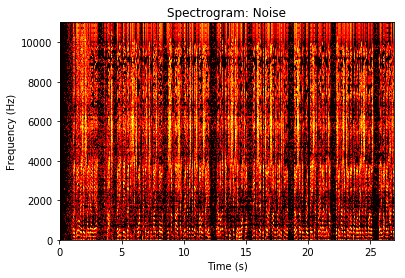
# 以下是显示噪声频谱
t_epsilon = 1e-2
S_one_sided=np.abs(SNR_est[:np.array(len(F)/2).astype('int'),...])
S_one_sided[S_one_sided<t_epsilon]=t_epsilon
plt.pcolormesh(T,F[:np.array(len(F)/2).astype('int')],np.log(S_one_sided),cmap=plt.cm.hot)
plt.title('Spectrogram: Noise');
plt.xlabel('Time (s)');
plt.ylabel('Frequency (Hz)');
-> Step 3/5: Estimate SNR -
 OK
6.2. 利用信噪比信息去除噪声
首先定义
根据信噪比计算每个频谱分量的权重
然后利用频谱权重对带噪声信号原始频谱进行加权
原理分析: 信噪比SNR越大,那么权重系数就越大(接近1), 所以加权之后的频谱会保留; 相反, 如果信噪比SNR越小, 那么权重系数越小(接近0), 所以加权之后的频谱就会作为噪声滤除.
[5]:
%---------------------------%
%       Estimate SNR        %
%---------------------------%
fprintf('-> Step 3/5: Estimate SNR -');
absS=abs(S).^2;
SNR_est=max((absS./vuvuzela_specgram)-1,0); % a posteriori SNR
if apriori_SNR==1
    SNR_est=filter((1-alpha),[1 -alpha],SNR_est);  %a priori SNR: see [2]
end
fprintf(' OK\n');

%---------------------------%
%  Compute attenuation map  %
%---------------------------%
fprintf('-> Step 4/5: Compute TF attenuation map -');
an_lk=max((1-lambda*((1./(SNR_est+1)).^beta1)).^beta2,0);  %an_l_k or anelka, sorry stupid french joke :)
STFT=an_lk.*S;
fprintf(' OK\n');
-> Step 3/5: Estimate SNR - OK
-> Step 4/5: Compute TF attenuation map - OK
6.3. 利用傅里叶逆变换得到时域语音信号
逆短时傅里叶变换通过IFFT计算每一个滑动窗口的时域信号, 然后重叠相加得到时域信号:
[8]:
%--------------------------%
%   Compute Inverse STFT   %
%--------------------------%
fprintf('-> Step 5/5: Compute Inverse STFT:');
ind=mod((1:window_length)-1,Nf)+1;
output_signal=zeros((Nw-1)*overlap+window_length,1);

for indice=1:Nw %Overlapp add technique
    left_index=((indice-1)*overlap) ;
    index=left_index+[1:window_length];
    temp_ifft=real(ifft(STFT(:,indice),NFFT));
    output_signal(index)= output_signal(index)+temp_ifft(ind).*window;
end
fprintf(' OK\n');
-> Step 5/5: Compute Inverse STFT: OK
[7]:
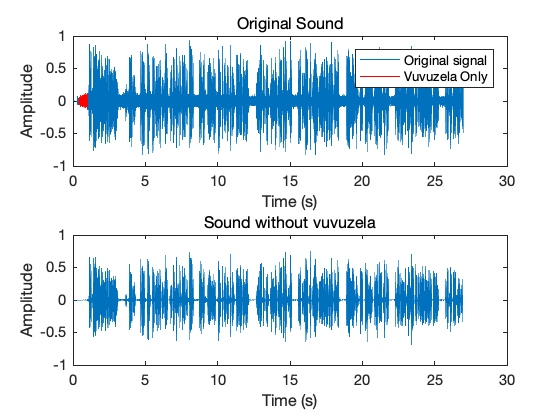
%----------------- Display Figure ------------------------------------
%show temporal signals
figure
subplot(2,1,1);
t_index=find(T>t_min & T<t_max);
plot([1:length(x)]/Fe,x);
xlabel('Time (s)');
ylabel('Amplitude');
hold on;
noise_interval=floor([T(t_index(1))*Fe:T(t_index(end))*Fe]);
plot(noise_interval/Fe,x(noise_interval),'r');
hold off;
legend('Original signal','Vuvuzela Only');
title('Original Sound');
%show denoised signal
subplot(2,1,2);
plot([1:length(output_signal)]/Fe,output_signal );
xlabel('Time (s)');
ylabel('Amplitude');
title('Sound without vuvuzela');
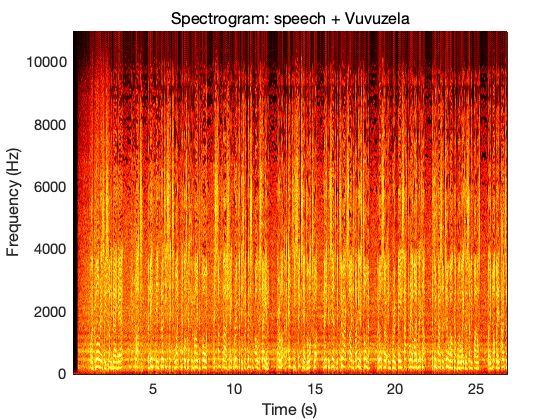
%show spectrogram
t_epsilon=0.001;
figure
S_one_sided=max(S(1:length(F)/2,:),t_epsilon); %keep only the positive frequency
pcolor(T,F(1:end/2),10*log10(abs(S_one_sided)));
shading interp;
colormap('hot');
title('Spectrogram: speech + Vuvuzela');
xlabel('Time (s)');
ylabel('Frequency (Hz)');
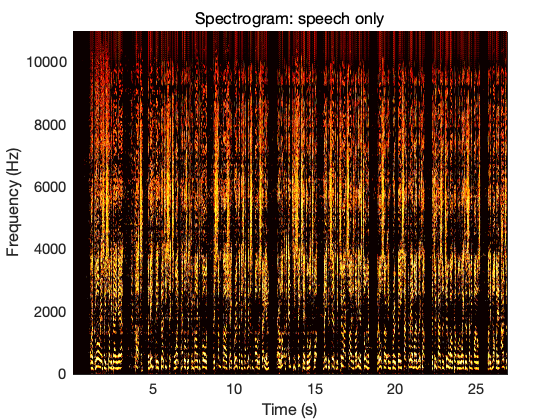
figure
S_one_sided=max(STFT(1:length(F)/2,:),t_epsilon); %keep only the positive frequency
pcolor(T,F(1:end/2),10*log10(abs(S_one_sided)));
shading interp;
colormap('hot');
title('Spectrogram: speech only');
xlabel('Time (s)');
ylabel('Frequency (Hz)');
[ ]: